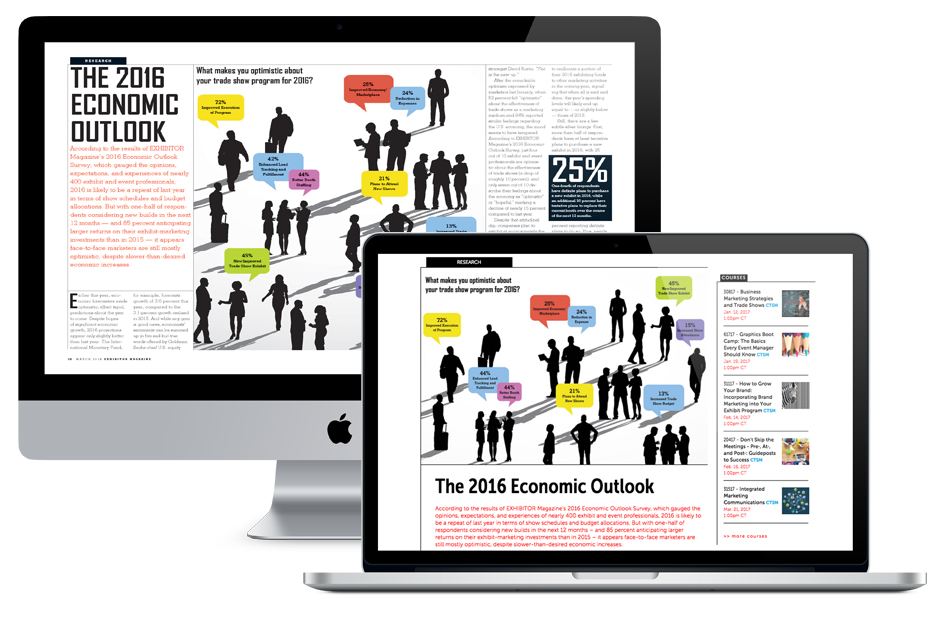
At Exhibitor Media Group, I analyzed data from survey results and created infographics to communicate research findings.
My Process
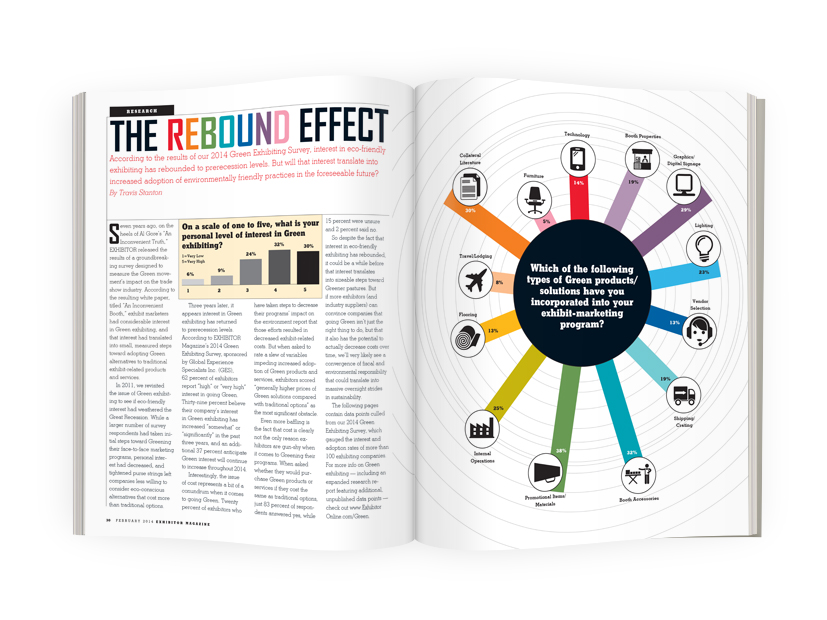
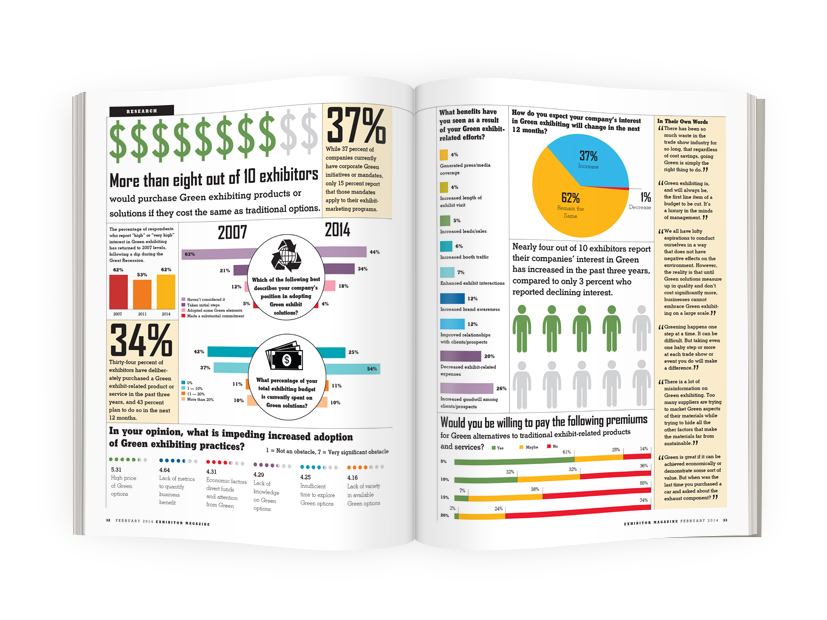
Exhibitor Media Group sent out surveys. I took the survey results and worked closely with the editor to prioritize which data must be published in print and if any information could live online. Upon analyzing the data, I determined if information could be presented as a pie chart or bar chart. I often looked at other infographics I found online or in other magazines for inspiration.
The Result
The design team of EXHIBITOR Magazine was recognized for Best Infographics by the ASBPE (American Society of Business Publication Editors) National Awards. My infographics have also been used in slideshow presentations by the CEO of Exhibitor Media Group.